Expats Love the Low Cost of Living in Kuala Lumpur but Not the Working Life
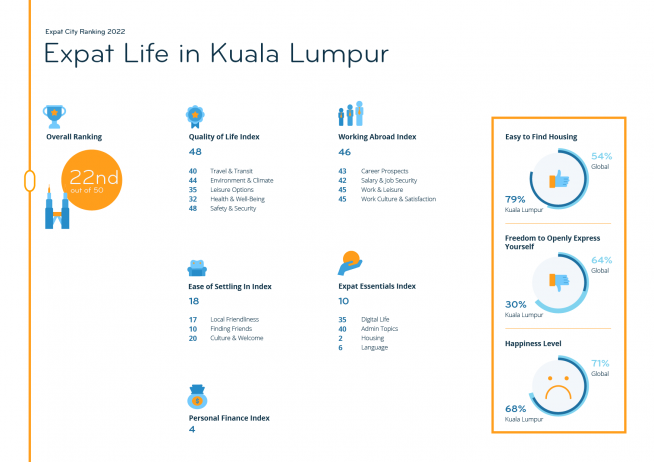
Ranking 22nd in the Expat City Ranking 2022 overall, Kuala Lumpur’s worst performance is in the Quality of Life Index (48th). The city ends up in the bottom 10 of the Environment & Climate (44th) and Safety & Security (48th) Subcategories: 42% of expats feel that the government does not support policies to protect the environment, more than double the global average (18%). And more than two in five say that they cannot openly express themselves and their opinions (42% vs. 18% globally) and are unhappy with the political stability (41% vs. 15% globally). Expats are also disappointed with the infrastructure for cars (41st) and the availability of public transportation (43rd). “The inadequate transport system in Kuala Lumpur and the traffic jams restrict mobility and hinder social life,” shares a British expat.
On the positive side, the city performs very well in the Expat Essentials Index (10th). This is largely due to its second place in the Housing Subcategory — only Bangkok (1st) performs better. Expats describe housing as easy to find (79% vs. 54% globally) and to afford (64% vs. 39% globally). Affordability seems to be a general trend, as the city ranks fourth in the Personal Finance Index. Over two in three expats (69%) are happy with the general cost of living in Kuala Lumpur (vs. 45% globally), and 86% feel that their disposable household income is enough or more than enough to lead a comfortable life (vs. 72% globally).
However, expats encounter more difficulties when it comes to the Working Abroad Index (46th). In fact, Kuala Lumpur ranks among the bottom 10 for every subcategory in this index: Career Prospects (43rd), Salary & Job Security (42nd), Work & Leisure (45th), and Work Culture & Satisfaction (45th). For example, over one in four (27%) are unhappy with their work-life balance (vs. 19% globally). Additionally, expats report that the local business culture does not encourage creativity / thinking outside of the box (43% unhappy vs. 26% globally), independent work and/or flat hierarchies (43% vs. 28% globally), or flexibility (31% vs. 19% globally).


